Science and technology
working with nature- civil and hydraulic engineering to aspects of real world problems in water and at the waterfront - within coastal environments
 We have tried to see Ocean Waves in the NATURE page through the eyes of a scientist and a poet. In this piece let us try to see how the born waves are transformed as it propagates – this time through the eyes of an applied scientist or engineer. I will mainly focus on ocean waves, although the discussed transformation processes apply to all different types of waves.
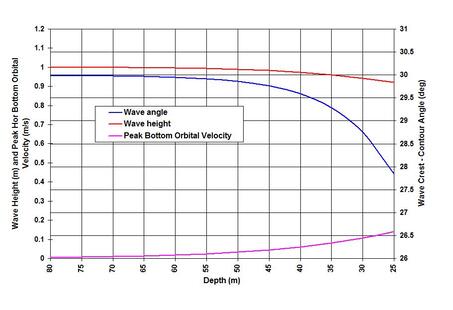
A natural water wave is the undulated response of water to transport the energy it gains – through the attractions of Sun and Moon as in a tide, sudden massive ocean floor rupture as in a tsunami, hurricane storms piling huge water mass as in a storm surge and, of course, through the blowing winds causing ubiquitous ocean wind-waves. The born waves are visible in the duality of crests and troughs, but are composed of multiple waves of different periods and heights built within them (as are vivid in harmonic decomposition of tidal waves, as well demonstrated in my 1991 COPEDEC-PIANC paper: Tidal observations and spectral analyses of water level data in the mouth of the Ganges-Brahmaputra-Meghna river system). Natural waves are spectromatic not only in terms of periods, heights and phases but also in directions. Some basics of wind-wave hindcasting and forecasting methods are reviewed in one of my publications {Wave Hindcasting. Encyclopedia of Coastal Science, Springer, 2005. Updated 2017}. As soon as a wave is born, it is subjected to the transformation processes as the energy propagates. The processes can best be described by three important parameters: wave height H, the height from trough to crest; local wave length L or wave period T, measured simply from crest to crest; and the local still water depth d. A very useful parameter proposed by Fritz Joseph Ursell (1923 – 2012) does use these three parameters to classify waves - to indicate whether they can be approximated by the 1st order processes of Linear Wave Theory proposed by George Biddell Airy (1801 – 1892). This parameter named in his honor as Ursell Number describes a threshold combining the two ratios H/d and d/L, and is given by U = HL^2/d^3. It turns out that for all practical purposes, waves can be assumed to be symmetric or linear, when U is equal to or less than 5.0. Further, it is important to know that a wave cannot sustain itself when it reaches the steepness at the threshold value of 1/7 or higher – steepness being the ratio of H over L. The unsustainability results in wave breaking and losses of energy – which is mostly seen as whitecaps in noisy wind waves. A criterion proposed by Miche {Le pou voir reflechissant des ouvrages maritimes exposes a l’action de la houle. 1951} captures the wave breaking thresholds not only due to the limiting steepness, but also due to the limiting water depth. . . . Next, it is useful to delineate the wave transformation region for convenience. A deep-water zone covers the areas where depths are higher than half of the wave length, L/2. The contiguous shallower region is known as the refraction zone and it starts from the deep-water limiting depth to the region where wave breaks, roughly at d = 1.28H in flat bottom. In reality, wave spectrum and beach slope also play a role in controlling depth-limited wave breaking. In the refraction zone waves start to feel the bottom and several changes happen in this zone – in particular the symmetry of the sinusoidal deep-water wave is lost by distortion – turning it into asymmetric at U = 5.0 or higher. In this piece we will be mostly talking about these two zones, but only the symmetric aspect of it. The nonlinear asymmetric wave phenomenon is highly elaborate by its own right, and hope that I will visit it at some other time. After breaking, the transformation processes result in dissipation of the entire wave energy in the surf zone, and to up in the beach slope in the swash zone. The dissipated wave energy rushes up the shore as a bore of very high velocity. As the energy is dissipated, water rushes down the slope by gravitational pull and by the suction of trough. Vigorous turbulence and sand movement characterize this zone shaping and reshaping the shoreline morphology. Again, it is helpful to focus on these processes separately and I hope to come back to it at a later time. . . . With these understandings let us turn our attention to see how waves are transformed. The dynamic equilibrium of things requires that the characteristics of transformed waves are determined by the balance of incoming energy against those due to dissipation, transmission and reflection. To keep this discussion to a manageable level, I will try to focus on wind waves. Waves developed by wind storms are highly irregular, noisy and short-crested, and the energy dissipation starts immediately by the interactions between the born waves and the lashing wind prompting steepness related breaking. . . . Among others, three other notable processes also start immediately in deep-water wave motions. The first is known as the frequency dispersion – frequency is the reciprocal of period, which means that a wave with a period of 10 second has a frequency of 0.1 hertz. This process involves separation of the long period components as they start to travel faster leaving behind the short-period ones. This is the reason why we see the fore-runners – long-period long-crested swells on coasts that have traveled far away from their sources of origin at a storm field. The second is the spectral evolution of waves through the wave to wave interactions. In a spectrographic display, peak wave energy proportional to H^2, is seen as concentrated at a certain frequency. The evolution process accounts for spreading out this energy in both ways toward the higher and lower frequencies, and also in directions. Those transferred to the higher frequency domain mostly break as the limiting steepness is reached, and can be seen as whitecaps. The third is the grouping of waves seen in the togetherness of high ones separate from the low ones. As pointed out in the Ocean Waves blog in the NATURE page, this process appears to result from the superimposition of component waves of different heights, periods and phases. The grouping, in essence imposes an additional long period wave envelope. . . . What are the simplest things that happen in the refraction zone? Let us list some of the simple processes in this zone. With the decreasing water depth toward the shore, the wave speed or the celerity of the wave energy slows down, the wave length decreases, but the wave orbital velocity increases. To demonstrate the processes, I have constructed a simple image shown in this piece. In this image, a 1-meter, 8-second wave approaching the shore-parallel contour at a 30-degree angle is followed on its journey to transformation. The shown analysis is limited within a region where the wave processes can be approximated by the Linear Wave Theory at U = 5.0. As the waves begin to lose its properties of symmetry shoreward, the processes start to become complicated, and I hope to come back to that at some other time. But I like to touch upon one simple aspect of non-linearity known as the Stokes Drift. . . . Stokes Drift named after the British mathematician George Gabriel Stokes (1819 – 1903) represents a residual current, also known as the mass transport velocity heading in the direction of wave propagation. The residual current is about 1-order less than the peak orbital velocity – which means that for a peak orbital velocity of 1 meter per second, the Stokes Drift would be about 0.1 meter per second. This non-linear effect was shown by Stokes by solving the unsteady Bernoulli (1700 – 1782) equation to the 2nd order. Stokes Drift explains the reasons why objects floating in the ocean finally end up on the shore, even in the absence of an appreciable ocean current. Apart from the nonlinear transformation, at least four other processes happen contributing to the evolution of waves in the refraction zone. These are reshuffling of wave energy, wave bending or refraction that accounts for wave crests becoming parallel to the shore, shoaling of waves, and frictional dissipation of wave energy at the bottom. It turns out that the frictional dissipation is very negligible in the linear wave region. While spreading out of the peak energy occurs in deep-water, in the shallow refraction zone the wave to wave interactions results in a one way process – the transfer of the peak energy to the high frequencies. The process results in a spectral evolution that approaches the specter of a solitary monochromatic wave. This is one of the reasons why the ratio of group celerity to individual wave celerity increases from n = 0.5 in deep-water to n = 1.0 in very shallow water. . . . Let us now turn our attention to the processes of refraction and shoaling. The attached image shows how the wave approaching at an oblique angle of 30 degrees is reduced to less than 28 degrees. This refraction process occurs due to the slowing down of wave celerity as it crosses the boundary from relatively deep water to a shallower area. It has been formulated by Dutch Astronomer Willebrord Snellius (1580 – 1626) for optics, and the refraction process is known as the Snell’s Law. As obvious in optics, refraction causes a brilliant light to become softer – so does a water wave – becoming less energetic by losing some of its energy in the process. While the refraction process causes the waves to lose energy, another process known as shoaling causes the waves to amplify. This process can simply be explained by the fact that as the wave length decreases, and the celerity slows down, the height has to increase to balance the energy. The contrasting influences of the refraction and shoaling processes results in a transformation that indicates the initial loss of energy density or lessening of wave height if the wave approach angle is high, and heightening of waves further shoreward. While this happens, the peak bottom orbital velocity gains strength as both the depth and wave length continue to decrease. What is the implication of reducing wave celerity and increasing orbital velocity? With waves becoming nonlinear, depth-limited wave breaking is initiated when a wave form can no longer be sustained because the increasing orbital velocity overtakes the decreasing celerity at some point. In a short article I have demonstrated how that happens in the case of an uprushing tsunami {Discussion of Maximum Fluid Forces in the Tsunami Runup Zone. ASCE Journal of Waterway, Port, Coastal and Ocean Engineering, 2008}. . . . Here is an anecdote to ponder: The disciple asked the master, “Sir, how am I today from yesterday?” The master smiled, “My friend that is a difficult question. But note this, as long as life’s energy flows, the response in humans occurs through the rise and fall of emotions and thought processes, like the crest and trough of a wave. And while all that happens, a human is transformed from one state to another. So the past you may not be the same you today, although your physical body is same like the water on which wave propagates. This is just how the dynamics of life, society and Nature work.” “Could I have been worse or better than yesterday?” “It all depends. Like the gravity tries to restore the wave undulations, so does the foundation in all of us. If you are built upon strong humane values, chances are that you are heading toward improving yourself. But a single day is too short a time to show any change in life.” . . . . . - by Dr. Dilip K. Barua, 4 August 2016
0 Comments
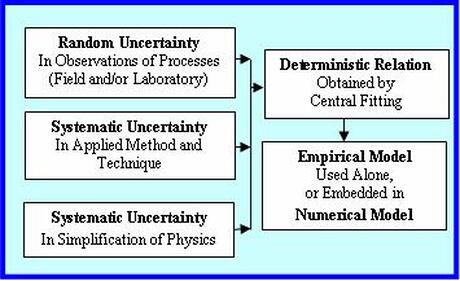 I have touched upon the uncertainty topic in the NATURE page. Uncertainties give rise to risks – for instance, in undertakings, and when the occurrence of a natural or an accidental event has the potential to cause significant effects. The subject represents one of the most important and complicated topics – not only in science and technology, but also in the wide arena of social sciences. It is only possible to cover it briefly in this piece.
I like to address the topic by initially attempting to explain uncertainty and risk processes, and then focusing on the uncertainty of methods, relations and models scientists and engineers use to determine or predict something. Part of this second aspect will be based on my paper {Longshore Sand Transport – An Examination of Methods and Associated Uncertainties. World Scientific} published in the 2015 Coastal Sediments Conference Proceedings. This paper investigates uncertainties of longshore sand transports using uncertainty propagation techniques. The described principle shown in the attached image is equally valid for other applications. A few words on the longshore transport. Longshore sand movement occurs parallel to a sandy shoreline within a wave breaking zone. It is triggered by waves approaching the shore at an oblique angle. On most shores, the transport represents a downdrift continuum, which implies that coastal engineering interventions need careful planning to accommodate the continuum rather than upsetting it. I hope to go more into that at some other time. . . . Uncertainty is about the lack of surety or confidence that produces indefensible ambiguous conclusions. This happens, especially when the uncertainty is very high. Yet it is unavoidable despite our advances in techniques and methods. The highest types of uncertainties are heuristics and rules-of-thumb used by individuals and groups to make judgement when no firm information is available. Let us try to go more deep into it. One type of uncertainty is eloquently defined in a U.S. Army Corps of Engineers {Institute for Water Resources, Coastal Storm Risk Management, 2011} publication: Uncertainty is the result of imperfect knowledge concerning the present or future state of a system, event, situation or (sub) population under consideration. Uncertainty leads to lack of confidence in predictions, inferences, or conclusions. This uncertainty resulting from imperfect knowledge is reducible by definition. It can best be understood by illustrating two triangles arranged side by side, one in a reverse direction than the other. In one triangle knowledge builds up from the minimum at the beginning of a project to the maximum at the advanced stage, while in the other triangle uncertainty goes down from the maximum to the minimum. In other words, as we expand our knowledge so do we reduce the uncertainty of conclusions we make. The other type of uncertainty is due to natural variability – I have referred to it in the NATURE page and will be covering it in this piece. This uncertainty is only negligibly reducible by improving observation methods. It can best be described and characterized by statistical and probabilistic methods. . . . How is risk management associated with uncertainty? We all loosely know the meaning of risk. We often say it is too risky to do that, or to go there. In each case what we mean is that doing that or going there will have dire consequences. So risk means that an event is likely to have undesirable consequences if attempted. In a broader sense, it is about taking a decision whether to execute something that is likely to have significant effects, or how to manage things in the case of a natural or an accidental event. With this initial understanding, let us try to delve into it more. Risk arises from an uncertain but probable event or condition that, if occurs is likely to have significant consequences. The assessment of these consequences requires careful analysis of the details of all the vulnerable components. The rigorous analysis is important for making informed and smart decisions on whether to take risk and how to manage it. Risk analysis relies on methods to identify, analyze, understand and predict the events and consequences. Damaging events, natural or accidental, are the most important of all events associated with high risks. In quantitative terms, risk is estimated as the product of the probability of occurrence of an event and the consequences of that event in losses of, and damages to lives, properties and economic activities. In a 0 to 1 scale, probability can be thought of as 0 being exceptionally unlikely, 0.5 being about as likely as not, and 1 being virtually certain. As we know, a low probability extreme event is higher in magnitude than a high probability one. Therefore, an event with a high probability of 1/10 is likely to have far lower impact or consequence than an event with a very low probability of 1/1000. Risk assessment can also be based on scenarios. Among others, this is particularly useful in assessing risks associated with climate change and sea level rise. The assessment becomes complete after establishing the likelihood or probability of the scenarios. I like to come back to that at some other time. In any case, it is required to have a careful and meticulous survey and assessment of all and everything that are likely to be impacted by events of different probabilities for some likely scenarios. An event is less risky if a densely populated area would have been sarsely populated. Similarly a robustly built well-planned area is less risky than a poorly built one. However, it is impossible to eliminate risk. Therefore engineering planning and design of measures are mostly conceived not to eliminate risk but rather to minimize it to a manageable level. Risk is also involved with the lifetime of a particular project. For example if a 100-year event is used to implement a 30-year life project, the risk that the event will occur at least once during the lifetime of the project is 26.0%. What is the most critical aspect of risk management? Once the risk analysis is completed to a justifiable level of confidence, leaders are handed down the most difficult task of defining the acceptable risk. We all know too well how wrong decisions could lead to disastrous consequences and daunting crises when stakes are high. . . . Let us now turn to the second aspect of this piece. The attached image shows that a relation, method or a model that one uses has some uncertainties built within it. They result from measurements, sampling method and simplification of physics. Uncertainties associated with measurements in the field or in the laboratory are random in nature, and can only be described by statistics. The other two represent systematic uncertainties or biases. There may appear another type of uncertainty, and that is due to human judgmental error. By definition, this can be reduced by training an individual to get skilled and to have inspired motivation, but it cannot be entirely eliminated. What are the simplest examples of systematic uncertainties? One simple example can be thought of like this – measuring a length by a marked stick and by a precise steel tape may produce two different lengths. This difference is due to the limitation or bias in each measuring system. To understand the bias associated with simplification of physics, I like to refer to the blog on Common Sense Hydraulics on this page. The water motion theory proposed by Daniel Bernoulli (1700 – 1782) and the small amplitude wave theory proposed by George Biddell Airy (1801 – 1892) represented some simplifications of physics. The simplifications and approximations helped the investigators to derive some very useful relations, and in doing so they helped us understand the complicated hydraulic processes easily. But they came at a cost – the cost of neglecting some parameters. This process of simplification introduces bias. Presented in terms of environmental issues and management – NAP 12568 is an excellent read on how uncertainty and the follow-up risk assessment procedures affect decision making. A recent NAP 27335 treatise has extensive discussions on data sharing, and associated issues on privacy, risks and confidentiality. All process-based models including computational models are based, partly or entirely on empirical observations – conducted either in the field or in the laboratory to derive relations by central fitting. In computational models, the embedded empiricisms include various source functions in the momentum or energy balance equations. The nature of some of the random and systematic uncertainties shown in the image is highlighted in my short article on suspended sediments {Discussion of Field Techniques for Suspended-Sediment Measurement. ASCE Journal of Hydraulic Engineering, 2001}. In an equation, the errors or uncertainties of individual variables in the right hand side propagate into the uncertainty of the dependent variable on the left side of the equation. How does that happen? Let us try to understand this more in the next few paragraphs. . . . Error and uncertainty are often used interchangeably. In quantitative terms, while the error refers to the difference between the measured and the true value, the uncertainty refers to the difference between the individual measurements and the mean of the measured. Defining the errors is important for laboratory proceedings, but for real-world problems it is the uncertainty that is relevant. Uncertainty of a parameter implies that there is no single value of it, rather a range of values are possible that lie within some limits. In statistical terms, this variability is assumed to follow the Gaussian bell-shaped curve about the arithmetic mean, and the curve limits defined by the standard deviation is the random uncertainty. This means that random uncertainty values lie within ± 34 % of the mean. Error or uncertainty propagation technique has been in use for long time dating back to the now known method since 1974. The most recent treatment of the subject can be found in the U. S. National Institute of Standards and Technology (NIST) and the American Institute of Aeronautics and Astronautics (AIAA). Perhaps the principle can best be explained through a simple example. Suppose, we consider an equation, C = A^2 * B. Let us say, the variables A and B on the right hand side of the equation have known typical uncertainties ± a, and ± b from measurements. How to estimate the uncertainty of C, ± c? According to the principle, the uncertainty of C can be determined as, c^2 = 2^2*a^2 + b^2. How do some typical uncertainties look like? Some examples of the typical uncertainties are: water depth ± 5%, wave height ± 10%, wave period ± 10%, and current speed ± 10%. The uncertainty propagation technique shows that some of the best longshore sand transport equations have uncertainties up to ± 100%. This uncertainty has nothing to do with the scientific merit of one relation over another; it was rather due to the uncertainties of the independent variables on which the relations depended. . . . Here is an anecdote to ponder: The disciple asked the master, “Sir, how best to understand bias and uncertainty?” The master replied, “Let me see if I can explain better. Suppose you see a person at different times. Depending on your own state of mind, you may find and interpret the same behavior of the person differently – sometimes friendly, sometimes antagonistic, etc. This is bias.” “But bias could also mean seeing and judging people based on skin color, upbringing, and socio-economic standing.” “Good point! Again, seeing and judging people as such, is conditioned by the observer’s own mind-set or conviction. The observed has nothing to do it.” “Thank you, Sir. And the random uncertainty?” “Uncertainty, on the hand, lies in the behavior of the observed, and has nothing to do with the state of mind of the observer. For example, if you watch a person responding to a single stimulus at different times under different circumstances, you would find that his or her behaviors are not always the same, they rather fluctuate around a mean. This pattern of behaviors of the observed is uncertainty.” . . . . . - by Dr. Dilip K. Barua, 28 July 2016  It is always fun to go back to the basics. Revisiting basics helps us refine our understanding, and interestingly there is always something new to learn each time we do so. I remember seeing a line somewhere that said: Learning is like rowing upstream not to advance is to drop back. I have heard a somewhat similar line from professors: We are constantly challenged by our graduate students. But don’t lose sleep thinking about this – some of us are required to do it because of our profession, others may be driven by interests in exploring the horizons of mind and intellect. For now, let us try to explore hydraulics, an interesting field of water science and civil engineering.
Hydraulics is the science of water in motion – in this blog we will focus on open-air hydraulics (a metaphorical image, credit: anon) in contrast to pressure flows as in pipes and conduits. Also, at a later time I intend to cover the hydraulics of sediment transport, which is vast in its own right. I have started the caption by suggesting that I will be talking about hydraulics as part of our common knowledge. But is there anything called common sense hydraulics? Well, it is all relative. We will try to see how human perception of water motion has changed from the common to the educated one. . . . Perhaps some knowledge is commonest of the commons. For example, apart from water that we use everyday either for drinking or for doing everything else, water is a wonder substance – a mystery – an uncertainty – a life blood – its fluidity intrigue us. Like all fluids, its behavior is determined by three fundamental properties known as viscosity, density and compressibility. The magnitudes of these properties are dependent on temperature, pressure and dissolved substances; and for most purposes water can be assumed to behave as incompressible. We have been seeing water motion from our childhood since we remember – flowing down the slope always finding the steepest one of least resistance. When obstructed the flowing water raises its head – or when we throw something solid in water, ripples radiate from the source of impact – or when dipped into water we feel lighter. These are some of our intuitive qualitative knowledge – we know their existence but most of us do not know how to explain them. Water flow has been utilized in ancient times since urbanized civilizations started to take shape across different cultures. There are many examples of wonderful water works in history. The Grand Canal of China (5th century BCE) was initiated to facilitate water transfer, navigation and irrigation; the Indus Valley Civilization at Mohenjo-Daro and Harappa (4th century BCE) developed extensive water supply and drainage networks; and the Roman Aqueduct (3rd century BCE) was built to transfer water for human consumption and irrigation. These ancient marvels of water engineering must have required advanced knowledge of hydraulics. But so far we know there was no documented knowledge to establish how sophisticated they had been. The earliest known piece of workable relation on hydraulics, hydrostatics to be specific, came from Archimedes (287 – 212 BCE). The accidental discovery of the principle of buoyancy by Archimedes explained why weight was lighter in water than in air. Humanity had to wait for many centuries before major breakthroughs in hydraulics started to emerge. It was the European Renaissance (14th to 17th century CE) that paved the way for the rejuvenated thinking in everything including hydraulics. . . . Well, where to start in describing the vast of amount of knowledge in hydraulics generated since the 17th century. Perhaps we should begin from the principle of dynamic equilibrium – a signature characteristic of natural processes I have briefly introduced in the NATURE section. Scientists try to understand fluid motion by considering a closed box known as a control volume. For simplicity, let us assume that there are no sources or sinks within the box. In one interpretation of the equilibrium principle, for parameters like mass, energy or force-acceleration duo, the rate of change of the parameter within the volume is the result of actions and reactions occurring at and across its surfaces. In term of force-acceleration along a certain direction, the key tool is the Newton’s (1642 – 1727) 2nd Law of Motion. The active forces acting on the volume are those due to gravitational pull, excess water pressure, wind shear at the water surface and mean wave pressure. The reactive forces are the viscous friction at the bottom, and the momentum exchange by turbulence and eddy. These reactive forces dissipate some of the flow energy. In response to these forces, the change that occurs within the volume is the rate of change of flow velocity in time and space. In addition, when the actual application of the principle covers a large area, the rotation of the Earth adds another force. The translation of these descriptive accelerations and forces into mathematical terms is known as the Navier-Stokes equation. French engineer Claude-Louis Navier (1785 – 1836) and British mathematician George Gabriel Stokes (1819 – 1903) are credited to have developed the mathematical elaboration. . . . How can we make sense of all the terms in the formidable Navier-Stokes equation, which is only solvable on the platform of computational modeling? How significant and sensitive is each term relative to the other? In my 2017 Encyclopedia of Coastal Science Chapter Seabed Roughness of Coastal Waters - I have presented the equation in simple and easily understandable terms. Further, a technique known as Scale Analysis is very useful to answer these questions. The technique involves approximating the differential calculus terms in the equation by representative scale values. It essentially translates the complex differential equation into an algebraic one. The beauty of such an analysis is that it helps us readily understand the behavior of water motion. In my presentations at the University of Central Florida in Orlando and at the Coastal Zone Canada Conference in Vancouver in 2008, I tried to show the usefulness of the technique. The scale analysis shows that in most natural flows a first-order approximation of the Navier-Stokes equation is governed by the actives forces of excess water pressure and gravitational pull resisted by the reactive friction force. The finding is not new however. This simple steady non-accelerating flow approximation has been worked out by Chezy (Antoine Chezy, 1718 – 1798), not by scale analysis but from observations. The relation got further refinement from Manning (Robert Manning, 1816 – 1897) nearly a century later that included pipe flow as well. Another significant approximation results from balancing the rate of change of flow velocity in space – the so called convective acceleration, against the active forces of excess water pressure and gravitational pull. Again it turns out that this approximation has been worked out by Daniel Bernoulli (1700 – 1782) in the 18th century. Bernoulli formulation of irrotational water motion in a steady frictionless environment is very insightful. It says that for a given condition, water level and speed are reciprocal to each other – in other words when motion speeds up water level falls, and vice versa. It says that a balance occurs between standing water pressure and dynamic water pressure – or in other words, between potential energy, pressure energy and kinetic energy. . . . Scale analysis also shows that the behavior of water motion is determined by the relative magnitudes of some basic forces. Among them, the gravitational pull, the force due to water motion or inertia, and the viscous friction are most important. William Froude (1810 – 1879) proposed a dimensionless number – a ratio of inertial force and gravitation pull, to show that water motion can be tranquil or torrential depending on the value of this number. Similarly Osborne Reynolds (1842 – 1912) showed that water particle motion can be parallel or erratically turbulent depending on the relative magnitudes of the inertial force and viscous friction. Apart from characterizing flows as such, these two definitions of dimensionless numbers paved the way for engineers to conduct easily manageable experiments on water motion by implementing miniature scaled replica of actual prototype conditions. Other notable developments include Newton’s gravitational theory explaining the reasons behind the tidal rise and fall of ocean water; and George Biddell Airy’s (1801 – 1892) simplified small amplitude wave theory based on solving what is known as unsteady Bernoulli equation. Also notable among the investigators was Blaise Pascal (1623 – 1662) who showed that a force imposed on water was equally transmitted in every direction – a mechanical behavior of water due largely to its incompressible property. . . . Do these information sound common? Well, perhaps not so common – but educated common. The described relations are part of what are known as the process-based models. Many hydraulic engineering problems can be reasonably solved or understood by simple process-based models like Chezy equation and Bernoulli equation. Someone might say: Come on, this is no-brainer. It turns out that an accomplishment appears no-brainer only after it is accomplished. Let me illustrate two simple examples from my own experience. I had the opportunity to scientifically explain the reasons for drainage congestion faced by seaward building up of deltas in Bangladesh. The process of delta building lengthens a drainage channel and thus reduces its seaward slope – the slope being the ratio of the height difference between head and tail waters, and the channel length. The Chezy relation tells us that, no matter what one does either excavating or dredging locally, the drainage rate is not going to improve if the overall slope remains flatter. Therefore spending money on channel excavation or dredging is likely to prove wasteful unless the real reason is addressed. This and other findings were presented in the 1993 University of Southern California Sea Grant Symposium on Coastal Ocean Space Utilization. . . . The other example is on characterizing morphological changes of erodible beaches by applying some simple ratios of wave height, wave period and sand particle settling velocity. These ratios were proposed by Robert G. Dean (1931 – 2015), one of the greatest talents in coastal engineering. Applied on Florida coast, the findings have shown that cross-shore morphology in some areas of Florida beaches is likely to remain erosive for 70% of the time in a year. This indicates that for ensuring a stable beach, either wave forcing needs to be reduced by engineered measures, or it should be replenished by borrowed sands on a recurring basis. No wonder, why Florida needs to make so much investments in beach replenishment each year. This and other findings including computational modeling were presented at the 2009 22nd Annual National Conference on Beach Preservation Technology. The reason for illustrating these simple examples is that most often we do not need to conduct elaborate computational modeling to understand hydraulic processes. We should not forget to look into our backyard to find some educated common knowledge to generate solutions, or to evaluate and interpret the performance of a computational model. . . . Here is an anecdote to ponder: The disciple asked the master, “Sir, one day I would like to walk on water?” The master smiled, “You know, someone has told me once that common sense is something not so common. I have paid no attention to that until now.” . . . . . - by Dr. Dilip K. Barua, 2 June 2016  In the first two blogs I have tried to introduce an overall picture of the Gift of Science & Technology (S & T) in defining and sustaining human civilizations. A big picture view of things is very helpful in understanding and judging a problem from different perspectives.
. . . With this and subsequent posts I will be entering into the core areas of my professional experience – in aspects of civil and hydraulic engineering within coastal environments. I will try my best to share some interesting topics in English. The task of discussing technical matters in plain language is not an easy one but that should not deter us. I hope that my scientific publications, contributions to the Coastal_List – an internet world forum of coastal scientists and engineers at the University of Delaware, and teaching of ocean engineering courses at the Florida Institute of Technology, will be helpful in this regard. Before I do so, I think it is appropriate to spend a little time on clarifying some of the premises on which this and other discussions will be based. First, where do engineers stand in the S & T field? Let me try to answer the question from a civil/hydraulic engineering point of view. . . . In the discipline of civil/hydraulic engineering, applied science provides the baseline knowledge on data and analysis, while technology provides tested products and materials. The role of an engineer is to find solutions to a given problem using resources from these two sources. To do it successfully, it is important for engineers to understand the necessary basics of the S & T. Failing in this matter affects the soundness of an engineer’s judgment. Therefore engineers are part of the S & T endeavors by being intricately involved in the development and progress – sometimes working at the forefront, but most often in the practical applications of science and technological advances to the real-world problems. In very challenging cases, engineers do their own science and technological investigations when S & T advances appear inadequate or unsatisfactory for a specific problem. Engineering is defined as the profession of applying technical, scientific and mathematical knowledge to plan, design and implement measures that are economical, harmless, safe and sound. Engineering professionals are considered as problem solvers. Is modern engineering education adequate to prepare students to see problems from different perspectives? Some people tend to think it is not adequate and that the employers should also share the roles of training. Without going along that line, it is important to consider the common view of some people about engineers. The most common view is that engineers have tunnel visions of things. If this view is correct, it is very serious because engineering is supposed to be a creative profession. Unless engineers see a problem from different perspectives, it becomes difficult for them to appreciate multiple aspects of a problem, and be creative and innovative in their judgments. But some others tend to argue that the tunnel vision of engineers is the unfortunate outcome of their own pursuit of perfection requiring them to focus on details. Yet there are others who think that stereotyping engineers as such amounts to blocking their career path in the corporate hierarchy. Whatever may be the case, engineers shoulder huge professional, ethical and legal responsibilities not only for the technical soundness of the proposed measures they propose, but also for the projects’ economy, safety and impact. These are all the more reasons why engineers should have a wide vision of things. I have used plural words like solutions and measures to indicate that engineers need to be creative to come up with a range of alternative solutions rather than a single one. I remember attending a meeting during my early career where we were reviewing one of our projects with a Dutch Government expert. The expert told us very bluntly that he would not accept a solution unless a range of alternatives were examined showing pros and cons of each one. . . . The reason for citing this simple encounter is to indicate that creativity and due diligence are two important requirements expected of an engineer to find a smart solution from an array of probable alternatives. Of course, many problems that engineers deal with, on day-to-day businesses are rather routine established undertakings. In many such projects, engineering is reduced to the job of a technician or a money-manager. The problem is that if they do such jobs for long, their technical and creative prowess are likely to loose sharpness with the sad consequences that the engineered solutions may lack substance and become unattractive and indefensible. When one thinks about the word engineering itself, it is often applied in a broader sense outside technical disciplines. People talk about politicians, planners and diplomats coming to an engineered solution. In these problem solving works, it is implied that, like in engineering, several alternatives are examined by screening, playing with and trading off criteria and constraints to arrive at a solution that all could agree upon. Often confusions arise on the roles of engineers and scientists in hydraulic and coastal engineering problems. Although both the disciplines overlap in some areas, they do see problems from different perspectives. Let me try to illustrate a scenario to show the difference in perspectives between a scientist and an engineer. . . . Let us ask both a single question, what is the applicable wave climate in this area of the coast relevant for design? An oceanographer would probably say, this is what we have measured and modeled . . . A smart engineer, on the other hand, having real-world application in mind would hesitate to answer directly and would probably say, . . . we have these, but . . . Why so? The hesitation is not an indication of the engineer’s inability, it is rather caused by the thinking that he or she would probably use the measured and modeled information, but only after examining them from the perspectives of adequacy, safety and risk, applicable codes and regulations. Applicable codes and regulations are minimum standards, which engineers must follow as a guideline and comply with them to avoid legal challenges. This leads us to say that the difference in perspectives between the two professions – is not in the process of analyzing a problem per se but in the goal – how and what they deliver in the end or supposed to do so. After all, an engineer is a scientist first. Further, both are well poised to deliver a smart answer or solution when they manage to philosophize an issue without carrying the baggage of a philosopher. The advantage with this line of thinking is that – it broadens the horizon of one’s mind to see things from both short and long term perspectives – further enabling him or her to see things from all different angles – their solutions, effects and implications. It is encouraging to note that at least two documents of the National Academies of Sciences, Engineering and Medicine – NAP 18722 and NAP 24988 have shed new lights on the necessity of collaborative and interdisciplinary thinking. . . . We have talked about learning from nature during other occasions. In this blog I like to highlight a concrete example of that notion. I do this by paying tribute to a creature that has important lessons to teach us. This little amazing creature is none other than a North American Beaver. I often post the image of a Beaver and the dam it builds on the clip board in my office with the caption, who is the better hydraulic engineer? Some of my colleagues might have thought I was challenging them. In fact, I was challenging all to think and understand how a Beaver could do things. How the hell do Beavers know where and how to put the anchor-twigs and branches? How do they place piece by piece to weave the dam so meticulously and diligently? How can they be so creative in finding and selecting the right materials? They never stop repairing and improving their creation. Not only that - the completed Beaver dam never blocks the entire flow; rather it lets some water to continuously trickle down to support downstream aquatic lives. The Beaver invite us to challenge its creativity, and its diligent and meticulous way of doing things. There are many examples of other creatures that show amazing fits of creativity and engineering. Perhaps it is our ignorance and inability to understand these amazing creatures that let us treat them as something unworthy of respect and care. Creatures like Beavers teach us to work with Nature rather than upsetting its processes. Working with Nature is only possible when we properly understand it. The understanding lets engineers develop the ability to be creative to generate alternatives and make scientifically and environmentally acceptable trade-off decisions. Well, so far so good. But we should not forget one hard reality – and this is the fact that like with all disciplines, engineers work within the practical constraints of a work place, administrative framework, cost, schedule and clientele. The luster of performance, creativity and innovation does suffer by constraints and circumstances that are beyond the control of an able engineer. One of my friends said, the topics you are talking about are very good and make sense. But how important are they in terms of helping an engineer in his or her career path? Do sincerity and professionalism really matter in a culture of showmanship, dishonesty and elbowing out each other? Well, that is an entirely different topic but an important and practical one, not only for an engineering profession but also for others. I tend to be an optimist however. . . . Here is an anecdote to ponder: The disciple asked the master, “Sir, I thought all we needed were concrete and steel.” The master smiled and looked away, “No surprise there. Umm! I am wondering where I can find some fresh air of alternatives.” . . . . . - by Dr. Dilip K. Barua, 26 May 2016  In a short blog posted before, I have introduced the idea about the Gift of Science and Technology (S & T) in defining and sustaining world civilizations. The role of this S & T sector of human activity is unlike any other – it is the foundation on which other sectors must rely in order to thrive successfully. The words primitive, backward or advanced used to describe and characterize a society, are nothing but a reference to the level or standard of S & T of that particular civilization. It is the S & T sector that has discovered and invented the elements of the Wheel of Progress, and human prosperity depends on how well the Wheel is rolled on to the future (image credit: anon).
. . . Who are these individuals in the S & T endeavors on whom social progress relies so much? What motivates them? Let us try to go back in time to answer the questions. Necessity is the mother of invention – that is where we need to begin. Survival instincts led early humans to innovate, to develop and perfect tools. One thing leads to another in the process of reincarnating knowledge and expertise – a process responsible for contributing to the social progression by leaps and bounds, or in a slow pace. It was the survival instincts of our early ancestors that motivated the smartest ones to think freely and creatively to develop tools and methods. Therefore we can safely say that it is the freedom of thinking and creativity in our genes that are responsible for turning the Wheel of Progress and prosperity. The smartest ones came from all walks of life – monks, philosophers, craftsmen and technicians, to name some. Many were self-motivators driven by curiosity, freedom of thinking and creativity. They were not called scientists or engineers – these professional labels came only after modern techniques of managing things were conceived. . . . If one looks at the long history of Chinese civilization, it would be clear how prolific Chinese scientists and engineers have been. There were hardly any areas of science, technology and engineering that escaped Chinese thinking, discovery and invention. In the Indian subcontinent, pre-Buddha Indus civilization, Buddha’s enlightened teaching (624 – 544 BCE), and post-Buddha developments at the world’s second earliest university at Nalanda (5th – 12th century CE) touched many aspects of spirituality, rational thinking, science and technology. Similar progresses happened in other corners of world. Notable among them were the civilizations that flourished in Egypt, Native America, in the states of modern Middle East, and Greek and Roman empires of Europe. We tend to think that these ancient civilizations are isolated, but archeological findings that come to light now and then, suggest that there have been cross-fertilization and cross-breeding among cultures. Conquests and the zeal to propagate religious teachings led the way in many respects. But perhaps more than we like to think, it was the migration of our ancestors in search of food and better living that made transfer of knowledge possible across cultures. In ancient times, it was most often the royal patronage that inspired master technicians and master craftsmen to innovate. It was the need for defense, and the desire for comforts of royals and nobility that drove the S & T sector growth. Other areas of quests for better living also played a role, but perhaps not to a substantial degree. It could be imagined that during this period, freedom and creativity were limited by the wishes of the royal patrons. Was this approach in the historic past destined to stagnate or fail? . . . The destiny was not clear until Europeans joined the foray. The European Renaissance (14th to 17th century CE) following the dark ages of Papal theocracy ushered in rejuvenated freedom in thinking and creativity. The pioneers including the new settlers in America collected and absorbed accumulated ancient knowledge, tools and methods from across cultures and refined them in workable forms that modern humans inherited. These new S & T endeavors have one distinct difference from others in the past. It was the drive to make huge profit from knowledge and inventions by producing things in a large scale for mass consumption. When masses are included in the equation – there appears another dimension to humans’ collective freedom, creativity and progress. While being the engine of progress, does profit also have the seeds of steering the S & T sector in the wrong direction? Well, things rarely progress well unless a framework of checks and balances is established. Perhaps that is where the roles of people, democracy and good governance are so important to steer things in the RIGHT direction, but without restricting freedom and creativity. Did everything go alright in the S & T progression? Most likely answer is yes because innovations are reflections of time and place to which they belong. However, we could imagine when applications of combustion engines were proposed, someone might have thought it was a stupid idea to cover the whole world with steel rail lines or cover Earth with pavements of concrete and asphalt. Others might have questioned why the S & T guys could not come up with better systems. It is not important whether or not those comments have really occurred, what is important is the fact that constructive comments and criticisms are always helpful in moving forward. The combustion engine technology was a breakthrough and it generated many other sets of supporting S & T innovations. One thing leads to another – all are tied to the universal knot of cause and effect. . . . In time, other services of economic activity evolved to fundamentally avail the pieces of the S & T pie, and managing the system by identifying and creating demand opportunities to distribute and sell the products. There came the financier or investor, the economists, the planners, the health care sector, the administrative outfits of political rule, bureaucracy, judiciary, media, law enforcement and security establishments. This means that in the modern management framework, support services play the role of a partner in rolling the Wheel. But in this framework there will always be some who would have the luxury of riding the Wheel at ease. Most often we see terms like nerds and geeks to describe the S & T people in a negative sense. What a terrible way to assume these poor souls as such – treating them like social outcasts, but who work hard to bring comforts to people’s lives! I am tempted to highlight some materials from a parody Shoe Invention by Bengali Nobel laureate poet Rabindranath Tagore (1861- 1941). . . . Once upon a time a King was disgusted with dusts and dirt sticking to his feet. He asked his court to find a solution. The court issued an order to dust all the walkways and roads so that no dirt could ever touch the King’s feet. As cleaning went on and on, the whole kingdom became so dusty that it was difficult to breathe. The King demanded an answer of the mess – the court started blaming each other but promised to find another solution. It came up with a brilliant idea of covering the walkways and roads with hide. Cobblers were found to do the task. But there were not enough hide to do the job. One courageous nerdy cobbler suggested that instead of covering the land it would make sense to cover the King’s feet. The court members became furious at the daring suggestion. How would they touch the King’s feet to bow and kiss! They decided to take the poor cobbler to the King to be hanged. The King started hearing the angry complaints of the audacious suggestion by the untouchable cobbler. He looked at the cobbler and said, “Let me see what you have got,” The poor cobbler trembling in fear presented the shoe he made. The King got the shoes washed to cleanse of the untouchable stains, but after wearing the shoe, he became very pleased and asked the court to reward the poor cobbler. Seeing the pleasure of the King, members of the royal court started fighting among themselves to claim the credit for the idea. The poor cobbler was caught, paid some pennies and was ordered to vanish from the kingdom so that the truth would never surface. . . . Well, we need nerds and geeks to carry us forward with the S & T innovations that knock at our door virtually everyday. It is their innovations in transportation and communication that have transformed the world so much so that it is becoming smaller and smaller bringing cultures together. Internet communication has opened the vista of resources and knowledge to most people around the world. In a profit making framework it is impossible to stop the S & T innovations. But sometimes innovation and progress appear so overwhelming that the future of mankind comes into question – the question of greed and malpractice, of wrong hands getting the control, or of the likelihood of disruption and modification of the natural evolution of human race and social living. Well, what can humans do? Like everything else, wherever lies the engine of progress, there also lies the seed of abuse. Collectively we have an option not to choose the later however. . . . Here is an anecdote to ponder: The disciple asked the master, “Sir, I am very inspired to be a part in turning the wheel.” The master smiled, “I am really disappointed to hear that! I thought it was much better to ride the wheel.” . . . . . - by Dr. Dilip K. Barua, 19 May 2016  What a better way than to start a page on Science and Technology! After all, civilization is nothing but a gift of these human endeavors. Despite abusive applications in conflicts, the foundation that this gift provides lets us build upon it. The comfort that it offers, allows other things to follow - the niceties of social life, humanity, and harmonious cohabitation by all in the planet Earth we call home. Take this gift away or let it stagnate, and the entire advanced social fabric that we know would collapse.
Are science and technology responsible for the destruction of Nature? Well, it doesn't have to be that way. . . . It is worthwhile here to quote LS DeCamp (1907 – 2000), an American writer: The story of civilization, in a sense is the story of engineering – that long and arduous struggle to make the forces of nature work for man’s good. Here are some interesting discussions that open our eyes on how scientists and engineers are treated in the mass-media avenues of public exposure: Knowing and Remembering the Past Scientific and Engineering Leaders. . . . . . - by Dr. Dilip K. Barua, 27 April 2016 |
 RSS Feed
