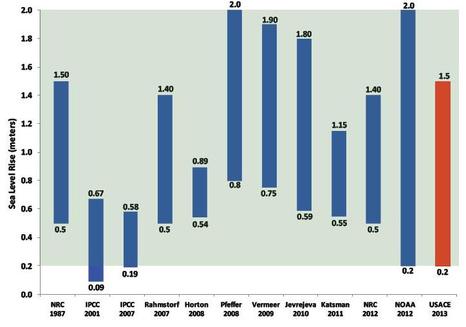
 The changing climate (In a later article Warming Climate and Entropy, posted in December 2019 – I have tried to throw some lights on the climate change processes of the interactive Fluid, Solid and Life Systems on Earth – the past, the present and the future) with its consequent effect on sea level is the most du jour topic of our time. It is not surprising – because there are many reasons for such popular attentions and human concerns. Some two-thirds of world’s seven billion people live within 100 miles of the coastline with the economic activities ranging from recreation to exploitation of sea resources to waterfront living, to gateways catering trade and commerce through many port and harbor infrastructure.
. . . There is a caveat however – that we should watch ourselves not to lose the voice of reason by yielding in to the mob mentality of bullying and accepting whatever floats around. The fluctuation of sea level with the consequent transgression and regression of the shoreline is a complex phenomenon – and as we will try to have a glimpse – it would appear that it is a complicated response to many forcings of various scales and magnitudes – both terrestrial and extra-terrestrial. In this piece I will mainly focus on the science of sea level rise (SLR), and intend to cover the consequences and adaptive responses to SLR on the SCIENCE & TECHNOLOGY page at some other time. During the past four decades considerable amounts of works have been conducted by multiple national and international organizations on SLR and implications. It is only possible to have a glimpse of it in this piece. My discussions are primarily based on knowledge gleaned from such resources as: UN entity IPCC (Intergovernmental Panel on Climate Change), US CCSP (Climate Change Science Program), US NOAA (National Oceanic and Atmospheric Administration), US NRC (National Research Council), US EPA (Environmental Protection Agency), USGS (United States Geological Survey), USACE (United States Army Corps of Engineers) and the Canadian National Research Council (CNRC). Some of the US works are published by the National Academies Press (NAP). To give a little background, I got interested in SLR in the 1990s, not so much as part of my professional responsibilities at that time, but as an effort of self-educating myself. The effort resulted in an article I published in 1990 in a Bangladesh national weekly. The article must have caught attention of some, because it was translated to Bengali subsequently. The concern about the effects of SLR on Bangladesh has begun to get global attention because most of the country’s territories are low lying deltaic coastal landscape. Dutch Government initiated some of the studies, and I was fortunate to officially review some of their projects. I was also involved in another project in vulnerability assessments of SLR. Some other subsequent involvements in USA and Canada were mostly in the scopes of side-line responsibilities. . . . Perhaps it is helpful to know a little bit of geologic history to understand the phenomenon of SLR. Long-term studies of scientific data indicate that the present sea level, stands on the geologic interglacial period, perhaps at its peak. Geologic history tells us that there have been four major cycles of glacial-interglacial periods with the corresponding low and high sea level stands in the 400,000 years before present (BP). The last lowest sea level at -120 meter occurred about 18,000 years BP. Try to imagine the scenario of that time when our shoreline was at the edge of the present continental shelf. During that time many landmasses separated by shallow seas were connected together. We still see the remnants of the past shoreline as river mouth scars or submarine canyons. What are the causes of these past sea level fluctuations? As pointed out, these fluctuations in sea level are due to many glacial and interglacial periods, or ice age sequences. Scientists have identified some eight causes for ice age sequences: (1) change in the Earth’s atmosphere or climate; (2) relative positions of the continents or change in the volumes of ocean basins; (3) fluctuations of ocean currents; (4) uplift of the roof of the world – the Tibetan Plateau; (5) variations in Earth’s orbit (known as Milankovitch Cycles); (6) variations in Sun’s energy radiation; (7) volcanisms; and (8) fluctuations in dust-ice albedo. So the real reasons for sea level fluctuations are much more complex than we tend to think. They vary from extra-terrestrial factors to the Earth’s atmospheric, topographic and oceanic controls, to volcanism and albedo change. . . . Now let us try to attempt to look at its behavior in the recent geologic past. From 18,000 years BP sea level has been rising – but not at a constant rate, rather at variable rates – sometimes faster than other times. This process is known as Flandarian Transgression or Holocene Transgression. On average, the SLR rate slowed down onward from 5000 years BP when the sea level stand was at –10 meter. We can generalize the rates in orders of magnitude like this: from 18,000 to 5,000 years BP, SLR rate was on average +10.0 millimeter per year, and the slowed rate from 5,000 years BP was about +1.5 millimeter per year. Well, if SLR rate has really slowed down to such an extent, why should there be so much concern? The answers to the question can be found in at least three important considerations. First, humans have encroached into the domain of sea at an alarming manner. Therefore, our SLR tolerance threshold has very little room for accommodation. We have built coastal cities, human habitation and port infrastructure by advancing into the sea redefining the shoreline. Scientists had very little idea about the phenomenon of sea level fluctuations until recent time – therefore they were not in a position to warn of the consequences of our appetite and adventure for more of the sea; even if they did, it fell into deaf ears of the decision makers. The second is the narrow window of tolerance within which all plants and living creatures including humans can survive. As we have seen in the Natural Equilibrium blog on this page, system of things remains in a state of delicate balance in Nature, in quests to attain dynamic equilibrium. The narrow tolerance threshold of humans and other flora and fauna means that they cannot afford to live when the adaptation or equilibrium time is long. In addition, the narrow tolerance levels make life and habitat vulnerable to the effects of rather minor changes. Because of the complexity of processes, these effects in stresses and disruptions of normal ways of lives and livelihoods are not always easy to address. The third, and perhaps the most important one is the disturbing findings of scientists that the recent SLR rate is highly correlated with global Warming Climate change. If one breaks down the recent past, within the past 1000 years CE, SLR rate was 0.0 millimeter per year, after that the rate rose to +0.6 millimeter per year, then declined to -0.1 millimeter per year for a short period of time. Starting roughly at the middle of the 20th century, the SLR rate has been rising at +2.1 millimeter per year. Scientists have found that this accelerated rate is positively correlated with the increasing greenhouse gas emissions, rise in atmospheric, land and oceanic temperatures, and the retreats of glaciers in the Polar Regions. The conclusion is that human activities are responsible for such an accelerated rate, and scientists have coined a new term, the Anthropocene Epoch starting in 1950 to mark the human footprints on the environment. . . . So far we have discussed the global SLR rate over time. How about the rates over space? Local SLR rates are highly variable from region to region. Let us try to see how SLR is defined in space. The first is often termed as Eustatic SLR, which refers to global change in the ocean volume – evidently when the basin becomes large, sea level falls, and vice versa. Overall, some other major factors contributing to SLR include: melting of continental and Polar ice masses, reduction in ocean water density and resulting expansion, ocean circulation responsible for distributing the heat and dissolved substances, isostatic rebound of the coastal landmass resulting from melting and regression of glaciers, uplift or subsidence due to tectonic activity, soft sediment consolidation and subsidence, and ocean-atmosphere interaction. Regional uplift or subsidence adds local flavor to SLR - for a subsiding coast SLR is more than an uplifting or rebounding coast. The subsidence can overwhelm the global SLR; for example, at the Mississippi River delta, the present SLR rates vary from +9 to +12 millimeters per year, far higher than the global average. The opposite happens at an uplifting coast. The phenomenon of regional variability - the enhanced SLR on subsiding coasts and the decreased SLR on uplifting coasts - is captured by a new term, the relative SLR. . . . Let us now turn our attention to the most difficult part of the SLR problem – and this is the problem with predicting the future change in sea level. The crust of the problem lies with the predictability of soft models employed by various investigators. We have discussed the typical nature of this modeling problem in the Natural Equilibrium blog on this page as well as in the Water Modeling and Uncertainty and Risk pieces on the SCIENCE & TECHNOLOGY page. To demonstrate it, I have included an image taken from USACE. The USACE has compiled the 2100 SLR predictions conducted by most involved organizations. Looking into the image, two striking feature should attract everybody’s attention. The first is the lack of agreements among the organizations. The second is the large difference between the maximum and minimum of individual predictions. The highest predicted SLR in 2100 is +2.0 m, compared with the lowest prediction of +0.58 m. Accepting one or the other comes with huge environmental risks and financial consequences. One may dare to ask whether the scientific correlation between the SLRs and the global warming is just another anomaly or uncertainty. The chances are that such a suggestion is highly unlikely; even if likely, it is important that humanity tries to minimize its footprint on the environment impacting lives of plants and other creatures. Because an unsustainable approach impacting others has only one door open – that is the door of compromising the future well-being of all. But one thing is sure, that the uncertainties associated with predictions make it hard for decision makers to conceive and develop adaptation strategies. Let us try to address this issue more in the SCIENCE & TECHNOLOGY page at some other time - posted in the Sea Level Rise - the Consequences and Adaptation. . . . Here is an anecdote to ponder: The disciple asked the master, “Sir, because global temperature and sea level stand have changed so many times in the past, I am wondering what would happen if instead of warming, we come across cooling of Earth.” The master looked at him and smiled, “Good Lord, this is not happening in our lifetime! But you have pointed out an important issue – that may haunt humanity at some time in the distant future in the human-scale of thinking. There is no doubt that such a scenario would cause absolute havoc in people’s mind. Perhaps everyone would cry for burning more and more fossil fuels to keep things warm. Or perhaps with lowering of sea level stand with glaciations, people will go further into the sea to build – the human appetite for exploitation will never cease. There may occur a reverse flow of refugees from colder countries to warmer ones – or war may break out.” “Human destiny in the hand of climate change!” “Yes, climate is the ultimate arbiter. Inevitability of such a scenario indicates the necessity of managing the Earth’s resources in a sensible manner for common well-being. The effort of sensible management is no easy task, however – because it would require real commitments from all nations by melting down vicious differences we see now.” “How about artificial creation of energy-emitting sun or suns. I have heard that such high level researches have been sponsored by many countries.” “It is encouraging that this and many other cutting edge researches are being initiated around the world, albeit at a high cost. Scientific leaders are thinking ahead than most of us realize. But practical outcomes of such endeavors usually take very long time – and there are considerable uncertainties in such efforts, even tangible benefits may never materialize. I guess though that the efforts result in gaining and perfection of knowledge in various supporting activities.” . . . . . - by Dr. Dilip K. Barua, 8 Septermber 2016
0 Comments
Leave a Reply. |

 RSS Feed