Science and technology
working with nature- civil and hydraulic engineering to aspects of real world problems in water and at the waterfront - within coastal environments
 I have touched upon the uncertainty topic in the NATURE page. Uncertainties give rise to risks – for instance, in undertakings, and when the occurrence of a natural or an accidental event has the potential to cause significant effects. The subject represents one of the most important and complicated topics – not only in science and technology, but also in the wide arena of social sciences. It is only possible to cover it briefly in this piece.
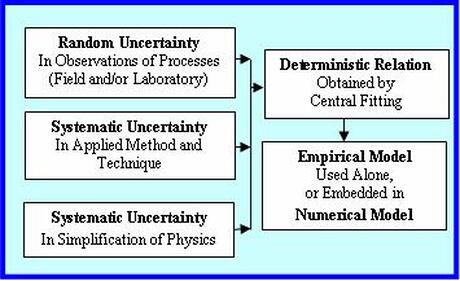
I like to address the topic by initially attempting to explain uncertainty and risk processes, and then focusing on the uncertainty of methods, relations and models scientists and engineers use to determine or predict something. Part of this second aspect will be based on my paper {Longshore Sand Transport – An Examination of Methods and Associated Uncertainties. World Scientific} published in the 2015 Coastal Sediments Conference Proceedings. This paper investigates uncertainties of longshore sand transports using uncertainty propagation techniques. The described principle shown in the attached image is equally valid for other applications. A few words on the longshore transport. Longshore sand movement occurs parallel to a sandy shoreline within a wave breaking zone. It is triggered by waves approaching the shore at an oblique angle. On most shores, the transport represents a downdrift continuum, which implies that coastal engineering interventions need careful planning to accommodate the continuum rather than upsetting it. I hope to go more into that at some other time. . . . Uncertainty is about the lack of surety or confidence that produces indefensible ambiguous conclusions. This happens, especially when the uncertainty is very high. Yet it is unavoidable despite our advances in techniques and methods. The highest types of uncertainties are heuristics and rules-of-thumb used by individuals and groups to make judgement when no firm information is available. Let us try to go more deep into it. One type of uncertainty is eloquently defined in a U.S. Army Corps of Engineers {Institute for Water Resources, Coastal Storm Risk Management, 2011} publication: Uncertainty is the result of imperfect knowledge concerning the present or future state of a system, event, situation or (sub) population under consideration. Uncertainty leads to lack of confidence in predictions, inferences, or conclusions. This uncertainty resulting from imperfect knowledge is reducible by definition. It can best be understood by illustrating two triangles arranged side by side, one in a reverse direction than the other. In one triangle knowledge builds up from the minimum at the beginning of a project to the maximum at the advanced stage, while in the other triangle uncertainty goes down from the maximum to the minimum. In other words, as we expand our knowledge so do we reduce the uncertainty of conclusions we make. The other type of uncertainty is due to natural variability – I have referred to it in the NATURE page and will be covering it in this piece. This uncertainty is only negligibly reducible by improving observation methods. It can best be described and characterized by statistical and probabilistic methods. . . . How is risk management associated with uncertainty? We all loosely know the meaning of risk. We often say it is too risky to do that, or to go there. In each case what we mean is that doing that or going there will have dire consequences. So risk means that an event is likely to have undesirable consequences if attempted. In a broader sense, it is about taking a decision whether to execute something that is likely to have significant effects, or how to manage things in the case of a natural or an accidental event. With this initial understanding, let us try to delve into it more. Risk arises from an uncertain but probable event or condition that, if occurs is likely to have significant consequences. The assessment of these consequences requires careful analysis of the details of all the vulnerable components. The rigorous analysis is important for making informed and smart decisions on whether to take risk and how to manage it. Risk analysis relies on methods to identify, analyze, understand and predict the events and consequences. Damaging events, natural or accidental, are the most important of all events associated with high risks. In quantitative terms, risk is estimated as the product of the probability of occurrence of an event and the consequences of that event in losses of, and damages to lives, properties and economic activities. In a 0 to 1 scale, probability can be thought of as 0 being exceptionally unlikely, 0.5 being about as likely as not, and 1 being virtually certain. As we know, a low probability extreme event is higher in magnitude than a high probability one. Therefore, an event with a high probability of 1/10 is likely to have far lower impact or consequence than an event with a very low probability of 1/1000. Risk assessment can also be based on scenarios. Among others, this is particularly useful in assessing risks associated with climate change and sea level rise. The assessment becomes complete after establishing the likelihood or probability of the scenarios. I like to come back to that at some other time. In any case, it is required to have a careful and meticulous survey and assessment of all and everything that are likely to be impacted by events of different probabilities for some likely scenarios. An event is less risky if a densely populated area would have been sarsely populated. Similarly a robustly built well-planned area is less risky than a poorly built one. However, it is impossible to eliminate risk. Therefore engineering planning and design of measures are mostly conceived not to eliminate risk but rather to minimize it to a manageable level. Risk is also involved with the lifetime of a particular project. For example if a 100-year event is used to implement a 30-year life project, the risk that the event will occur at least once during the lifetime of the project is 26.0%. What is the most critical aspect of risk management? Once the risk analysis is completed to a justifiable level of confidence, leaders are handed down the most difficult task of defining the acceptable risk. We all know too well how wrong decisions could lead to disastrous consequences and daunting crises when stakes are high. . . . Let us now turn to the second aspect of this piece. The attached image shows that a relation, method or a model that one uses has some uncertainties built within it. They result from measurements, sampling method and simplification of physics. Uncertainties associated with measurements in the field or in the laboratory are random in nature, and can only be described by statistics. The other two represent systematic uncertainties or biases. There may appear another type of uncertainty, and that is due to human judgmental error. By definition, this can be reduced by training an individual to get skilled and to have inspired motivation, but it cannot be entirely eliminated. What are the simplest examples of systematic uncertainties? One simple example can be thought of like this – measuring a length by a marked stick and by a precise steel tape may produce two different lengths. This difference is due to the limitation or bias in each measuring system. To understand the bias associated with simplification of physics, I like to refer to the blog on Common Sense Hydraulics on this page. The water motion theory proposed by Daniel Bernoulli (1700 – 1782) and the small amplitude wave theory proposed by George Biddell Airy (1801 – 1892) represented some simplifications of physics. The simplifications and approximations helped the investigators to derive some very useful relations, and in doing so they helped us understand the complicated hydraulic processes easily. But they came at a cost – the cost of neglecting some parameters. This process of simplification introduces bias. Presented in terms of environmental issues and management – NAP 12568 is an excellent read on how uncertainty and the follow-up risk assessment procedures affect decision making. A recent NAP 27335 treatise has extensive discussions on data sharing, and associated issues on privacy, risks and confidentiality. All process-based models including computational models are based, partly or entirely on empirical observations – conducted either in the field or in the laboratory to derive relations by central fitting. In computational models, the embedded empiricisms include various source functions in the momentum or energy balance equations. The nature of some of the random and systematic uncertainties shown in the image is highlighted in my short article on suspended sediments {Discussion of Field Techniques for Suspended-Sediment Measurement. ASCE Journal of Hydraulic Engineering, 2001}. In an equation, the errors or uncertainties of individual variables in the right hand side propagate into the uncertainty of the dependent variable on the left side of the equation. How does that happen? Let us try to understand this more in the next few paragraphs. . . . Error and uncertainty are often used interchangeably. In quantitative terms, while the error refers to the difference between the measured and the true value, the uncertainty refers to the difference between the individual measurements and the mean of the measured. Defining the errors is important for laboratory proceedings, but for real-world problems it is the uncertainty that is relevant. Uncertainty of a parameter implies that there is no single value of it, rather a range of values are possible that lie within some limits. In statistical terms, this variability is assumed to follow the Gaussian bell-shaped curve about the arithmetic mean, and the curve limits defined by the standard deviation is the random uncertainty. This means that random uncertainty values lie within ± 34 % of the mean. Error or uncertainty propagation technique has been in use for long time dating back to the now known method since 1974. The most recent treatment of the subject can be found in the U. S. National Institute of Standards and Technology (NIST) and the American Institute of Aeronautics and Astronautics (AIAA). Perhaps the principle can best be explained through a simple example. Suppose, we consider an equation, C = A^2 * B. Let us say, the variables A and B on the right hand side of the equation have known typical uncertainties ± a, and ± b from measurements. How to estimate the uncertainty of C, ± c? According to the principle, the uncertainty of C can be determined as, c^2 = 2^2*a^2 + b^2. How do some typical uncertainties look like? Some examples of the typical uncertainties are: water depth ± 5%, wave height ± 10%, wave period ± 10%, and current speed ± 10%. The uncertainty propagation technique shows that some of the best longshore sand transport equations have uncertainties up to ± 100%. This uncertainty has nothing to do with the scientific merit of one relation over another; it was rather due to the uncertainties of the independent variables on which the relations depended. . . . Here is an anecdote to ponder: The disciple asked the master, “Sir, how best to understand bias and uncertainty?” The master replied, “Let me see if I can explain better. Suppose you see a person at different times. Depending on your own state of mind, you may find and interpret the same behavior of the person differently – sometimes friendly, sometimes antagonistic, etc. This is bias.” “But bias could also mean seeing and judging people based on skin color, upbringing, and socio-economic standing.” “Good point! Again, seeing and judging people as such, is conditioned by the observer’s own mind-set or conviction. The observed has nothing to do it.” “Thank you, Sir. And the random uncertainty?” “Uncertainty, on the hand, lies in the behavior of the observed, and has nothing to do with the state of mind of the observer. For example, if you watch a person responding to a single stimulus at different times under different circumstances, you would find that his or her behaviors are not always the same, they rather fluctuate around a mean. This pattern of behaviors of the observed is uncertainty.” . . . . . - by Dr. Dilip K. Barua, 28 July 2016
0 Comments
Leave a Reply. |
 RSS Feed
