Science and technology
working with nature- civil and hydraulic engineering to aspects of real world problems in water and at the waterfront - within coastal environments
 In this piece let us talk about another of Ocean’s Fury – the Storm Surge. A storm surge is the combined effects of wind setup, wave setup and inverse barometric rise of water level (the phenomenon of reciprocal rise in water level in response to atmospheric pressure drop). Also important in the surge effects is tide because the devastating disasters occur mostly when the peak surge rides on high tide (the superimposition of tide and storm surge is known as storm tide).
The wind setups as a minor contributor to water level rise occur in most coastal water bodies during the periods of Strong Breeze (22 – 27 knot; 1 knot = 1.15 miles/h; 1.85 km/h; 0.51 m/s) and Gale Force (28 – 64 knot) winds (see Beaufort Wind Scale) – during winter storms and landward monsoons – and are measurable when the predicted tide is separated from the measured water levels. Such setups and seiche (standing wave-type basin oscillation responding to different forcing and disturbances) are visible in water level records of many British Columbia tide gauges. Storms are accompanied by high wave activities, consequently wave setups are caused by breaking waves. Wave setup is the super elevation of the mean water level – this elevation rises from the low set-down at the wave breaker line. Let us attempt to understand all these different aspects of a storm surge – but focusing only on Hurricane (wind speed > 64 knot) scale storms. . . . I have touched upon the phenomenon of storm surge in the Ocean Waves piece on the NATURE page telling about my encounter with the 1985 cyclonic storm surge on Bangladesh coast. Later my responsibilities led me to study and model some storm surges – surges caused by Hurricane ISABELLE (CAT-2, September 18, 2003), Hurricanes FRANCES (CAT-2, September 5, 2004) and JEANNE (CAT-3, September 26, 2004), Hurricane IKE (CAT-2, September 12, 2008) on the U.S. coasts. Some materials of my U.S. experiences are presented and published (Littoral Shoreline Change in the Presence of Hardbottom – Approaches, Constraints and Integrated Modeling, FSBPA 2009; Sand Placement Design on a Sand Starved Clay Shore at Sargent Beach, Texas, ASBPA 2010 [presented by one of my young colleagues at Coastal Tech]; and Integrated Modeling and Sedimentation Management: the Case of Salt Ponds Inlet and Harbor in Virginia, Proceedings of the Ports 2013 Conference, ASCE). . . . In response to managing the storm effects, many storm prone coastal countries have customized modeling and study tools to forecast and assess storm hazard aftermaths. The examples are the FEMA numerical modeling tool SLOSH (Sea Lake and Overland Surges and Hurricanes) and GIS based hazard effects analysis tool HAZUS (Hazards U.S.). The SLOSH is a coupled atmospheric-hydrodynamic model developed by the National Hurricane Center (NHC) at NOAA. The model does not include storm waves and wave effects as well as rain flooding. NHC manages a Hurricane database HURDAT to facilitate studies by individuals and organizations. WMO-1076 is an excellent guide on storm surge forecasting. . . . What are the characteristics of such a Natural hazard – of the storm surge generating Hurricanes? The Hurricanes (in the Americas), Cyclones (in South, Southeast Asia and Australia) or Typhoons (in East Asia) are a tropical low pressure system fed by spiraling winds and clouds converging toward the low pressure. Perhaps an outline of some of the key characteristics will suffice for this piece.
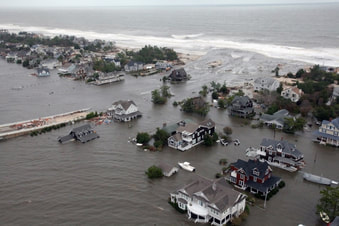
Before going further an important puzzle needs to be highlighted. Both the short wave and the long storm surge wave are generated by the dynamic pressure or kinetic energy exerted by the speeding wind; and their magnitudes are proportional to the square of the speed (referring again to Daniel Bernoulli, 1700 – 1782). Why are there two different wave types? What are the processes responsible for their formations? The questions may sound naive, but the answers may reveal some valuable insights. The short wave is the water surface response to transporting the gained energy in progressive wave motions. Like the turbulent wind, these waves are highly irregular and spectral. The storm surge waves, on the other hand result from the hydrodynamic balance between the wind-induced water motion and the resistance of that motion by the coast. The result is the piling up of water at the coast – a standing long wave. One should not forget however that the transformation aspects of a long wave – the processes of funneling, resonance (note that a storm surge is not monochromatic, therefore some frequencies may resonate to the basin natural frequency) and shoaling also play a role. These processes affect the storm surge height in wide continental shelves and in closed basins, and are discussed in the Tsunami and Tsunami Forces piece on this page. To illustrate the storm surge, I have included an image of the CAT-1 Hurricane SANDY (October 29, 2012) storm surge on the New Jersey coast. . . . To manage this discussion into a short piece let us focus on a CAT-2 Hurricane characterized by a wind speed of 90 knot and a eye pressure of 970 millibar. Let us attempt to estimate some orders of magnitude of inverse barometric effect, wind setup and wave setup. Inverse barometric effect is often simplistically estimated as: 1 centimeter rise of water level in response to 1 millibar of pressure drop. For the example storm, the pressure drop at the center of the eye is 30 millibar – resulting in a reciprocal water level rise of 30 centimeter. This rise is rather like a moving dome of water having a typical diameter of some 30 kilometer. As one can imagine this simple estimate, however small that may be, cannot be added directly to the wind and wave setups because these two effects occur at the eye wall where wind speed is the highest. . . . How does the wind setup occur? Sustained winds cause a water surface drift current in the direction of the wind. For the example CAT-2 Hurricane, the surface drift current in absence of an obstruction would be about 1.4 meter per second. For a landfalling Hurricane, when the shoreward surface-layer current is obstructed by the coast, water level rises at the coast to balance and cause a seaward bottom-layer current (the generated bottom current erodes and transports sediments seaward changing the morphology of the coastal sea). A simple estimate shows that the example CAT-2 Hurricane would cause a wind setup of 2.7 meter for a 50 kilometer wide continental shelf with an average water depth of 10 meter. To give an idea of the wave setup let us consider a maximum significant wave height of 4.0 meter, and a maximum wave period of 14 second (these parameters roughly corresponds to those measured during Hurricanes FRANCES and JEANNE near the coast). An estimate shows that the wave setup is about 1.2 meter, about 30% of the wave height. In aggregate the storm surge for the example CAT-2 Hurricane is in the order of some 3 meter – likely less in some areas and more in others. The Hurricanes FRANCES, JEANNE, IKE and ISABELLE registered surge height of about 2.0 meter in some places. What is the periodic scale of a storm surge? For the slow moving Hurricanes like FRANCES and JEANNE, it was about 4 days (from the time of rising to the time falling at the same water level), and for Hurricane IKE it was 1.5 days. Note that the periodic scale of this size covers 2 or more tidal cycles – but the damages mostly occur when the surge peak coincides with high tide (even more so when coincides with spring tide). . . . The complicacy of storm surges can best be described by numerical modeling. But it is also possible to estimate the surge more elaborately as a function of distance and time. Apart from damages, structural destruction and dike overtopping and breaches, storm surges greatly change nearshore and beach morphology providing works for summertime waves to reshuffle and redefine them. What we have discussed so far is positive storm surge that occurs on the right side of a landfalling Hurricane in the Northern Hemisphere. A negative storm surge, popularly known as the Sea Level Blow Out – also occurs simultaneously on the left side. See more in the Frontal Wave Force Field in Force Fields in a Coastal System. We have discussed about the likelihood of enhanced storm activity with Warming Climate on the NATURE page and also on this page. The high storminess together with the accelerated Sea Level Rise is only inviting humans to realize the consequences of our actions and face Nature’s Wrath – perhaps to a degree that modern humans have not witnessed before. When I started this piece, I thought of writing it as a small one. Instead, I ended up spending more time on this, resulting in the usual 4 to 5 pages length. Well what can one do when materials are overwhelming? . . . . . - by Dr. Dilip K. Barua, 3 November 2016
2 Comments
Vishal Murali
2/1/2021 03:09:42 am
Hello! I just read this article and found it really interesting. Though I was searching for some information to complete my school project, I came across this article and actually it caught my attention. Thank you, creator of this article! Looking forward to learning more! :) 2/3/2021 09:57:23 am
Vishal: glad that you have found it interesting and useful. Dilip Leave a Reply. |
 RSS Feed
