Science and technology
working with nature- civil and hydraulic engineering to aspects of real world problems in water and at the waterfront - within coastal environments
![]() . . . the trouble with the world is that the stupid are cocksure and the intelligent are full of doubts. . . This saying from Bertrand Russell (1872 – 1970) is similar to what The Tathagata said in the 152nd verse of the Dhammapada: The man of little learning grows old like a bull. He grows only in bulk, but, his wisdom does not grow. These sayings point one to look deep into things to open one’s wisdom eye, to see the reality of the nature of things – of the existence of uncertainty in the sphere of knowledge (see The Quantum World; Uncertainty and Risk and The World of Numbers and Chances). The necessity of seeing as such – dawns as we continue to learn more – as the horizon of our knowledge continues to expand.
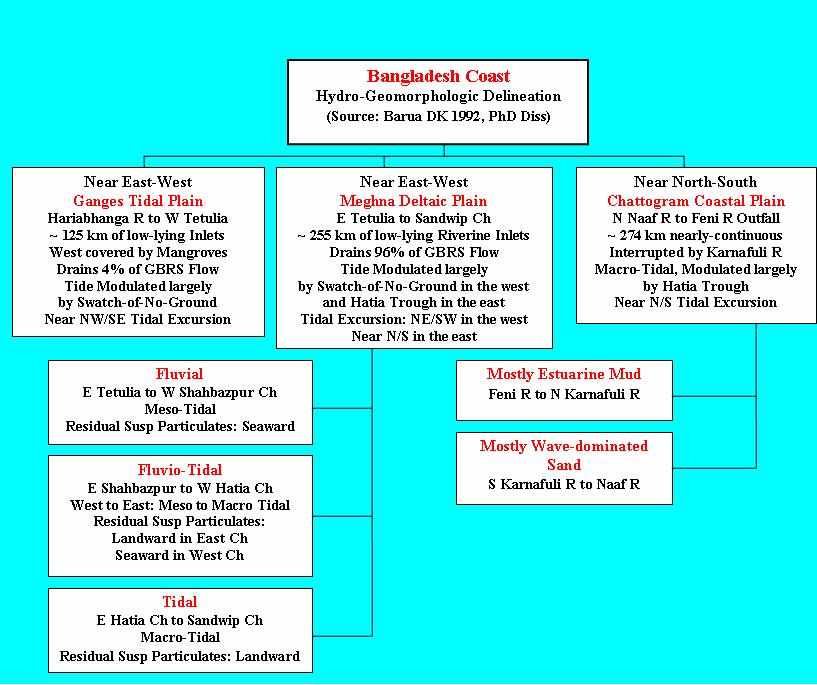
Perhaps – our learning process starts as we begin to develop questions in our mind – like if or when. In computer programming ifs and the answers to such ifs – are used to direct processes in different directions – so does our learning processes. Questions similar like these, reflecting on the past: if I had done things differently . . . if I had been informed differently or were able to see things through my own lens . . . if I had someone powerful on my back . . . so on – and so forth. And intelligent answers to them help us chart future directions. Similarly, such questions can be framed in our mind – at any time – to help examining the pros and cons of making decisions. Sometimes, we fail to ask such questions in time, and mistakes are made – from which recovery becomes difficult. It’s like one of Tagore (1861 – 1941) songs: keno jaminee naa jheta jagelaa naa – saying, why didn’t you wake me up before it was dawn. In one way or another – the consequences of making decisions based on answering ifs –– define the interdependent fluxes in the evolving canvas of life in time, and in the space where one lives – the spacetime. And as we do so, we begin to realize what Benjamin Franklin (1706 – 1790) once said: . . . without continual growth and progress, such words as improvement, achievement, and success have no meaning . . . Starting from these words of wisdom, let us attempt to understand some dynamics of currents in coastal oceans off rivermouths – focusing on the one, off the mouth of Ganges (Ganga) Brahmaputra River System (GBRS; or the GBM system). Needless to say that such understandings – are very imperative to initiate, manage and execute Civil Engineering on Our Seashore – to achieve sound and sustainable goals. Engineering services are involved in one way or another – in the processes of attaining the 17 interconnected UN declared Sustainable Development Goals (SDG). . . . 1. Coastal Currents Intro Thought of presenting some findings from the 2nd Chapter of my Ph.D. Dissertation – with a note that unlike in An Alluvial River’s Sedimentary Functions, I am keeping the name Brahmaputra River in line with my Dissertation – although its reach in Bangladesh is known as the Jamuna River. Some aspects of this chapter were presented in the Characterizing Wave Asymmetry, with discussions of some theoretical frameworks posted in Nonlinear Waves. This is the only chapter – which I could not manage time to send the manuscript for journal publication. Other chapters are published: Chap 1 (1991), Chap 3 (1995) and Chap 4 (1994). Facilitated by my major Prof WS Moore, the 2nd Chapter benefited from the works and advice of my Dissertation committee member Prof B Kjerfve. Acknowledging them in gratitude – let me move forward to focus on the main contents of this piece – on coastal ocean currents. In this essay, I am doing this very briefly with some of the interpretations and explanations that accrued from my later experiences and related publications – some of which are summarized and listed in the ABOUT page. Among them, the most relevant publications for this article are: the 1990 IEB Journal Paper on Estuary; the 1991 COPEDEC-PIANC paper; the 1993 Practices and Possibilities; the 1994 Karnafuli River Estuary Hydraulic Behavior; the 1997 Active Delta; the 2001 Suspended Sediment Measurement; the 2002 Geometric Similarity of Deltas; the 2004 Settling Velocity of Natural Sediments; the 2008 Fluid Mud; the 2015 Longshore Transport; and the 2017 Seabed Roughness. It is also enriched by the works done while writing several articles posted in the WIDECANVAS. Before I begin, a short note on The Coastal Force Fields is helpful. The fields represent a playground of many forcings and responses of different time-scales afforded by different constraints – defined by isobaths and the land-water interface at the shoreline/coastline (see more in the Civil Engineering on our Seashore). Together, the system of forces head to reach dynamic equilibrium (see Natural Equilibrium; Water Modeling). According to the force fields defined there – GBRS mouth is governed by forces – that are in dominant actions, but differing in the contexts of both space and time - the Metocean Force Field (MOFF), the Extraterrestrial Force Field (ETFF), the Land Drainage Force Field (LDFF) – are all there, together with the Frontal Wave Force Field (FWFF) – which is active in the proximal shoreline and shallow areas. As well important is the Storm Surge that frequents the coastline often. Currents or velocity fields are generated by the development of pressure gradients generated by the highlighted force fields. They are a manifestation of hydrodynamic interactions – of force and response fields – as depicted in the image of Force Fields in a Coastal System. . . . 2. The Hydro-Geomorphologic Setting – the Processes and Forms. Let me begin by referring to the attached image (it is enriched by some materials discussed in the Coastal River Delta) – that summarizes some of the key hydro-geomorphologic features and processes of Bangladesh coast. The definitions and delineations have been used by many subsequent authors to describe Bangladesh coastline. The delineation identifies two major groups – the first is the (~) 380-km near-east-west delta of the GBRS, and the second is the (~) 274-km near north-south stretch of the Chattogram coastal region – the Chattogram Coastal Plain (CCP). Following the terms defined in the Force Fields in a Coastal System, the hydrodynamics of these two groups are fundamentally different – with the regular playground of spring-neap ETFF – more so in the eastern channels than in the west. The delta is the showcase of interacting LDFF and MOFF during the four months of the wet-monsoon – roughly from June to September. While the dominance of LDFF is present close to the shore delta fringes – the MOFF dominance is in contagious seas offshore. In the second group CPP – on the other end, MOFF is the dominant process riding on top of ETFF. The first group can be divided into two: the (~) 125-km long coastline of the Ganges Tidal Plain (GTP) in the west, and the (~) 255-km long coastline of the Meghna Deltaic Plain (MDP) in the east. Of these, the first draws only 4% of the GBRS flow – with the delta fringes of multiple interlinked estuaries colonized by extensive mangrove forests – the Sundarbans that stretch from India to Bangladesh. As the name suggests, the GTP is mainly tidal with muddy estuarine channels fringed by narrow and pocket beaches of fine sands at the shoreline. The second draws the other 96% of the GBRS flow – and is the highly dynamic active delta of the GBRS. Horizontal coastal erosion rate to the maximum of 400 m/year, and the vertical sediment accumulation rate to the maximum of 3 m/year were observed (the 1997 paper). The delta is stratified horizontally (the 1990 paper) in current patterns and SST (suspended sediment transport; see the Hydraulics of Sediment Transport for definition) – with seaward residuals in western channels and landward in the east. With such trends of differing residual transport directions associated with stratification, the delta-building processes appear poised to prograde southwestward with gradual of shoaling of eastern channels. Two submarine canyons incise Bangladesh coastal ocean. The first is the Swatch-of-No-Ground (SNG) – or Ganges Canyon in the west (the SNG has a width of 30 km, at 200 m isobath, and penetrates 130 km deep into the continental shelf). A shallow trough – the Hatia Trough (HT) runs parallel and close to the CCP. As discussed further later, these two canyons modulate tidal phenomenon ETFF processes in the Bangladesh coastal ocean. . . . 3. The Measurements – the Time, Tide, Site and Season. Let me briefly outline the measurements on which the findings described in this article are based (please refer to Chapter 2 of my 1992 Dissertation for details). A total of three different sets of 13-hour time-series hourly observations cover several stations. Land Reclamation Project survey vessel, M.V. Anwesha was used for observations. A Decca navigation hyperbolic system was used for positioning. The vessel was let to weather-vane – positioned by a bow anchor (with an anchor-chain measuring 3 times the water depth). Velocity was measured by an Ott propeller current meter. A 50 s exposure time was used to obtain the flow velocity. The propellers were calibrated before the measuring campaign in the calibration tank of Bangladesh Water Development Board and were accurate within (+-)2%. With one current meter suspended from a davit located on the mid-section of the ship, measurements were made at three depths (1 m below surface, mid-depth and 1 m above bottom), either starting at the surface or at the bottom, and sampling the mid-depth position during hoisting or lowering. Depending on the depth, 8 to 10 minutes were required for the exercise. The velocity direction was measured by the ship's navigation compass and the deviation from it was noted by a pendulum current meter lowered simultaneously at the level of the current mater. A total 14 measurement sites were covered – in waters between 5 and 20 m isobaths. Of them, 4 are off the GTP – one at the head of SNG with 3 others on the west of it. Three sites are in locations parallel to CCP stretching from the head of HT to Sandwip Channel. The rest 7 measuring stations are located off MDP. The first set of measurements representing a spring tide – covers 5 stations from 27 November to 1 December 1989. Measurements at these stations were repeated the following week (5-9 December) during a neap tide. These sets of measurements during November-December represented GBRS slow falling stage. The second set of measurements representing a mean tide – covers 6 stations during a 22-26 August 1990 period. This set of measurements during August represented GBRS peak stage. On a 17-24 October 1990 period, a third set of measurements cover 6 stations. During this period, the first measurement on 17 October represented a spring tide, and the rest, a mean tide. This set of measurements during October represented rapid falling stage of the GBRS flows. A lone measurement on 15 March 1991 during a spring tide represented a flat low GBRS stage. Among these, the August 1990 measurements represented southwest monsoon while those in October, November-December was during the northeast monsoon. These two seasons represent contrasting wind speed magnitude and directions. Swells having 12-16 s periods were observed at a station, west of SNG during the October 1990 measurements. For a location in the Bay of Bengal near the SNG, sea and swell charts of the U.S. Navy (1965) indicate high seas and swells from southwest in August – moderate seas and swells from Southeast in October – and low or negligible seas and swells from northeast in November and December. . . . 4. Coastal Water and Wind-driven Circulation. Here is a gist on the nature of changing seawater salinity (see Coastal Water to know aspects of it) at measured stations, and the wind-driven circulation (see Storm Surge to know aspects of it). The depth-and time-mean (averaged over the semi-diurnal tidal cycle) salinities indicate the enormous influence of GBRS at the measured stations. At no station does the observed salinity exceed 50% of the full strength seawater salinity. Stations sampled in August 1990 during the peak river-discharge period were fresh or mildly brackish. As expected the seawater salinity off the MDP is substantially lower than those stations on both east and west sides – indicating a high influence of GBRS fresh water flow at these stations than others. All the measured stations show a vertically well-mixed situation. Time-mean salinities at 1 m below surface and at 1 m above bottom showed negligible variations over the depth. Absence of vertical density stratification indicates that no estuarine type circulation is present (see aspects of it in Managing Coastal Inlets). Countries bordering northern Indian Ocean experience oscillating monsoon wind systems. The southwest (June through September) and the northeast monsoons (December through February) cause the reversal of circulation in the Bay of Bengal. It can be noted that when wind blows for a long time (for a pendulum day, which is 65 hours for Bangladesh coast; Dissertation) against a coast, a drift current develops and a wind set-up is created at the coast. The wind set-up causes a slope current down the gradient. The drift current is a function of depth and due to frictional resistance at the bottom, is higher near the surface. The combination usually results in a net onshore surface drift current and a net offshore slope current along the bottom. . . . 5. Submarine Canyons Refract Tide. The set of measurements in waters between 5 and 20 m isobaths – covering nearly the whole stretch of Bangladesh coastal ocean indicate something very interesting about the refraction of tidal wave by deep submarine canyons. Measurements on the two sides of the SNG reveal that the tidal excursion directions are different on the two sides of the canyon. Most of the shelf areas surrounding the SNG receive tidal forcing from it. While a dominant northeast (rising)–southwest (falling) tidal excursion occurs on the east of SNG, the same on the west is northwest (rising)–southeastward (falling). This pattern, observed for the first time in my Dissertation works – indicates that tide propagating faster through the canyon than the surrounding shelf areas – refracts to either side The result is that the surrounding shelf areas receive tidal forcing generated from the canyon. It appears, however, that this refracting effect of SNG on the tidal motion does not cover the areas as far east to HT. The excursion pattern in stations near HT shows a nearly rectilinear tide propagating through it – and is oriented north-south. Analogous to the refraction of short waves by a submarine trough, a canyon causes divergence of tidal wave energies on both sides of it. The result is a higher amplitude tide on both sides than at its head. The agreement to this observation can be found in co-range tidal lines. Why the tidal waves propagating through SNG and HT are different? Answer to this question becomes apparent from the principles of long wave transformation outlined in the Tsunami and Tsunami Forces piece. On shoaling and funneling of long waves I have written: The phenomena of shoaling and funneling can best be understood by applying the energy conservation principle, often known as the Green’s Law. This simple principle assuming no losses of energy by friction, etc., shows that for a gradually shoaling continental shelf, the ratio of height increase is proportional to the reciprocal of the ratio of depth decrease raised to the 1/4th power. For a channel gradually decreasing in width, the funneling effect is given by the ratio of height increase that is proportional to the reciprocal of the ratio of width decrease raised to the 1/2nd power. In the case of tide propagating through the gradually varying configuration of HT, both the effects of shoaling and funneling are pronounced – resulting in amplification of tide continuing up to Sandwip and Hatia Channels with further effects there (the COPEDEC-PIANC paper). In the case of SNG – the canyon is so deep incised into the continental shelf that the propagating tidal wave virtually does not feel the Green’s Law effects until reaching the head of the canyon. But, there it faces the reflection from the steep canyon wall. The combined effects of loosing energy by reflection and refraction must be the primary reasons why the tidal ranges in areas around SNG are lower (lower than HT areas). However, once the refracted wave spews out from SNG on to the shelf – it becomes subjected to the effects of shoaling – with some amplification and further effects on way into estuaries. The SNG pattern is evident from the observed tidal excursion pattern and explains the general alignment of linear tidal ridges shown by 5 and 10 m isobaths. T Off (1963) described northwest-southeast aligned linear tidal ridges on the west of the SNG reflecting the observed tidal excursion pattern there. In the east, JM Coleman (1969) noted that the distributary mouths and the 5 m isobath are directed toward SNG. Tidal currents aligned to canyon/trough directions are reported to be present in the Indus Trough (EP Shepard and RF Dill 1966). In addition, alternating currents have been measured at the head of different canyons having the frequency of the dominant tidal motion (EP Shepard, NF Marshall, PA McLaughlin and GG Sullivan 1979). More than a century ago, J Fergusson (1863) remarked that the SNG is maintained by the scouring action of the convergence of two tidal currents rotating in opposite sense at the head of the canyon. As revealed in my Dissertation, the rotations of tidal currents are not in opposite sense – but have different excursion patterns. . . . 6. Tidal Oscillation, Currents and Residuals: The three sets of described measurements are fairly representative of the river hydrograph and the changing monsoonal wind pattern. In spite of a few exceptions, the data indicate some interesting hydrodynamic characteristics of the surveyed area. A clockwise turning tidal motion is observed at some stations while an erratic pattern is observed at others. The erratic pattern indicates a possible influence of coastal topography. The nearshore stations show rectilinear tidal motion in agreement with the channelised configurations of isobaths at those stations. Tidal motion types are indicated by showing the phase relationships between the observed water levels and the depth-mean tidal currents. An in-phase relation was observed at a station at the head of HT (as far south near Cox’s Bazar) – indicating a progressive wave-type tidal motion there. More shoreward, close to the entrance of Sandwip Channel, however, the tide develops into a standing wave type motion – shown by the phase lead of velocity by about 90o. Near SNG and in other deep waters – the processes of transitioning from progressive to standing wave type were observed with a phase lead of velocity by 1 hour or 29o. Standing wave-type oscillation was observed in inner shelf areas shoreward of 20 m isobath, indicating that coastal reflection of the incoming progressive tidal motion starts becoming effective shoreward from these depth-ranges. Tidal energy shown by variance of the depth-averaged tidal current was found to be a power function of tidal range: V = 0.07 - 0.02T+ 0.13T^2 (V = Variance; T = Tidal range). A depth-mean velocity vector variance of 2.17 m^2/s^2 was observed in Sandwip Channel near the entrance of Karnafuli River during a tidal range of 4.20 m (it is a macro-tidal environment). At the head of SNG for a tidal range of 1.20 m, the depth-mean velocity vector of 0.13 m^2/s^2 was observed (it is a meso-tidal environment). Variance of tidal currents is a measure of kinetic energy. Decomposition of flow vectors into orthogonal components shows that the Northings have higher amplitude, a leading phase and a higher variance than the Eastings. Comparison of the Northings over the vertical, at 1 m below surface and at 1 m above bottom, shows that the bottom velocity has lower amplitude but a leading phase than the surface velocity. The differences suggest that the near-bed sediment can have a different transport direction than the surface transport. . . . There we have it – a brief synopsis of coastal ocean current dynamics off rivermouths – where the actions of tide, seasonal riverine flow and wind conditions (for details see Chapter 2 of my Dissertation) define the force fields. This article is dedicated to celebrate the 51st anniversary of Bijoy Dibash – the Day on 16 December 1971 marks the Liberation of Bangladesh from the tyranny of Pakistani rule. Let freedom loving people from around the world come together to breathe the fresh air of emancipation – by being conscientious, heedful and diligent – whenever – wherever – whatever. And let us do that by remembering Charles Dickens (1812 – 1870), the British writer, novelist and social critic: have a heart that never hardens, and a temper that never tires, and a touch that never hurts. . . . The Koan of this piece: Be mindful what you think, say or do, because the Sun has the habit of not shining on one place for long . . . . . - by Dr. Dilip K. Barua, 16 December 2022
0 Comments
|
Dr. Dilip K Barua
Archives
October 2024
Categories |